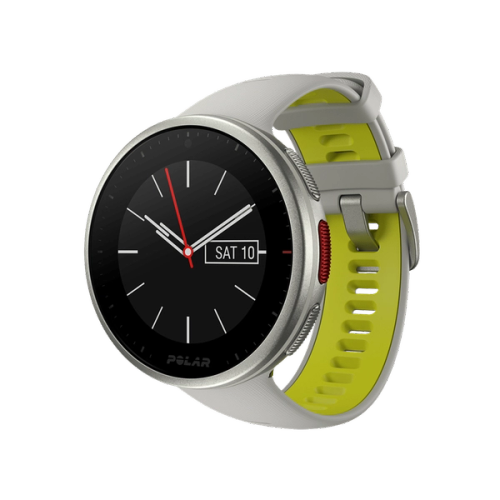
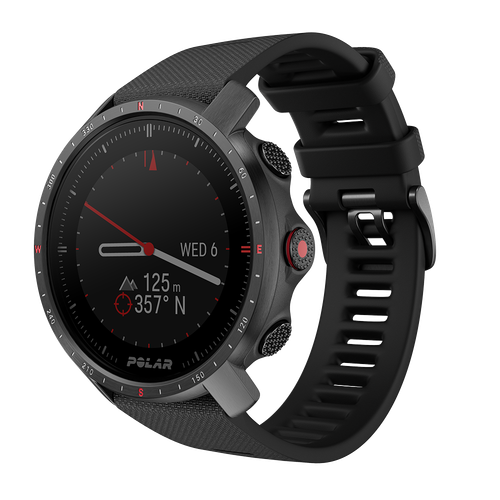
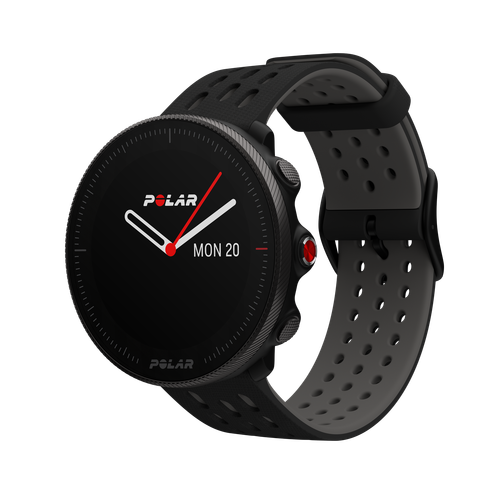
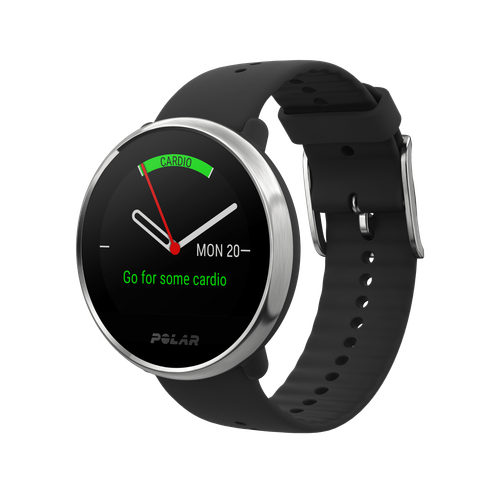
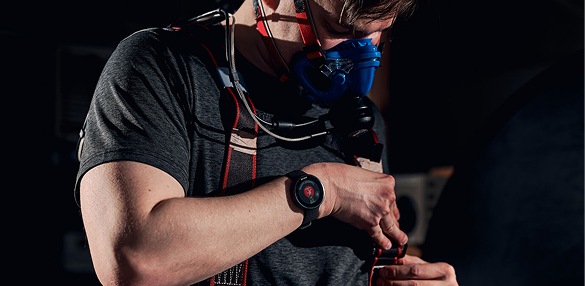
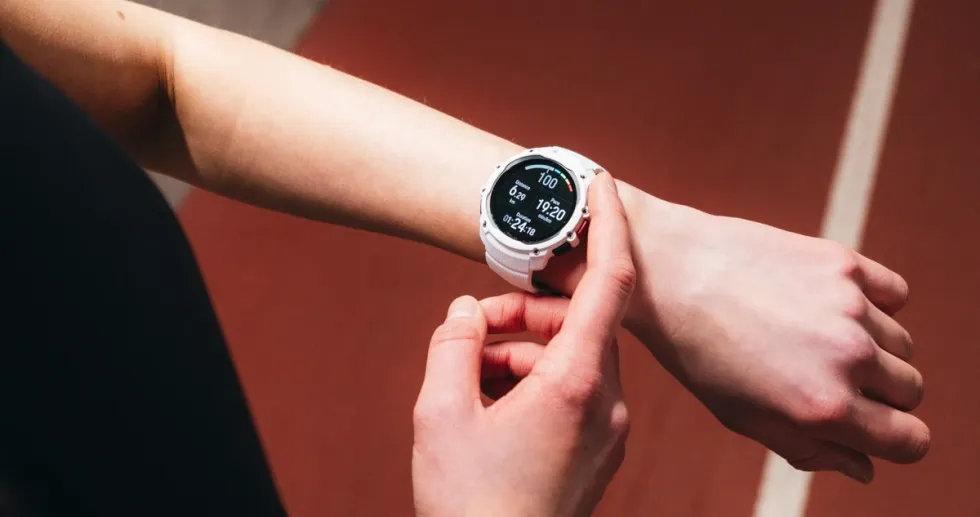
You hit start on your watch, settle into your stride, and glance down at the screen. Its crisp, multicolored display tells you you’re perfectly locked into zone 2. You feel reassured because, well, it looks beautifully scientific. But the thing is, if your settings rely on the standard 220-minus-your-age formula to map those heart rate zones, then, unfortunately, this precision is an illusion.
While frequently quoted as an easy way to calculate your maximum heart rate, 220-minus-your-age is a legacy formula that dates back to the 1970s and is based on population averages, meaning your actual heart rate zones could easily be off by ±10–11 beats per minute in either direction. So that easy recovery run you think you’re executing might actually be a moderate-intensity effort, steadily accumulating fatigue and undermining the adaptation you’re training for.
So, instead of letting a math equation dictate your fitness, this guide will show you how to anchor your training zones to real physiological thresholds. You will learn what they actually measure, how to uncover your true numbers using Polar’s built-in Running and Cycling Performance Tests, and exactly how to calibrate those metrics in Polar Flow to unlock true data accuracy on your wrist.
The 220-Age Problem: Why Default Zones Miss the Point
The standard formula for calculating your training zones is built on a surprising secret: it was never meant to be a gold standard. The “220-minus-your-age” equation emerged from a 1971 compilation of data drawn from prior studies with inconsistent methodologies and populations. It was never derived from a formally validated, peer-reviewed study, yet it has become the default architecture for the fitness industry.
The problem with applying this generic formula to your training is its high standard deviation, as mentioned above. Consider two 45-year-old athletes lining up for a workout. A default calculator will rigidly prescribe both an identical maximum heart rate (HRmax) of 175 bpm. Based on a documented standard error of 7–11 beats per minute (Robergs & Landwehr, 2002), one might have a true metabolic maximum of 164 bpm while the other easily reaches 186 bpm. If they both run at a default zone 2 pace, one is working far too hard to build an aerobic base, while the other isn’t stimulating enough adaptation.
This error compounds when your device splits your heart rate into the useful yet rigid, mathematical 10% blocks (such as zone 2 being defined as 60%-70% of your estimated max). Biology simply doesn’t work in clean decimals. Research confirms that these arbitrary percentages are often disconnected from individual metabolic realities (e.g., Jamnick et al., 2020). Your true aerobic threshold (LT1)—the actual boundary where lactate begins to rise—doesn’t care about a population average. Depending on your genetics, training age, and athletic history, your actual LT1 can fall anywhere from 60% to 85% of your true maximum.
As generic equations cannot account for these vast individual differences, the only way to build an effective training plan is to bypass the statistics and uncover your unique physical baselines. Doing this requires moving away from theoretical models and entering a practical, data-driven framework. By following a structured process, you can systematically isolate your true thresholds, update your gear, and transform your wearable tech from a generic estimator into a highly specialized laboratory on your wrist.
Step 1: Establish Your Baseline with Accurate Hardware
So, why does personalizing your training zones require this dual approach? Because executing a scientifically validated test protocol yields little benefit if the sensor capturing your performance introduces corrupted data into your training metrics.
Think of it like using a miscalibrated bathroom scale. If the scale itself is inherently flawed, tracking your weight daily won’t give you an accurate picture of your progress; it will only track a consistent error. The same logic applies to your cardiovascular data. If your heart rate monitor introduces noise or fails to react dynamically to changes in effort, the numbers you type into Polar Flow will be fundamentally skewed from the start.
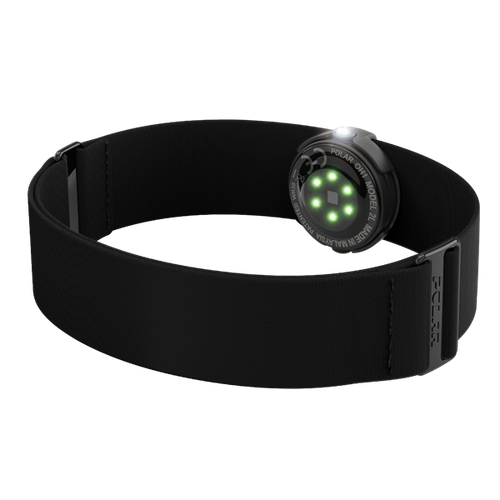
While optical wrist sensors are incredibly convenient for day-to-day tracking and resting heart rate (RHR) metrics, they face significant physiological hurdles during high-intensity training. The explosive biomechanical impact of running, rapid wrist movements, and the dynamic cardiovascular demands of threshold efforts can introduce data artifacts exactly when precision matters most—making optical sensors less reliable for zone-setting and performance testing than for general activity tracking.
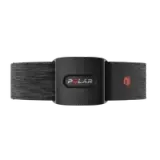
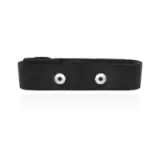
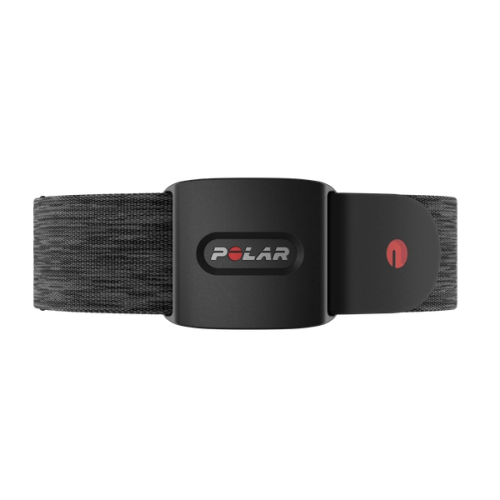
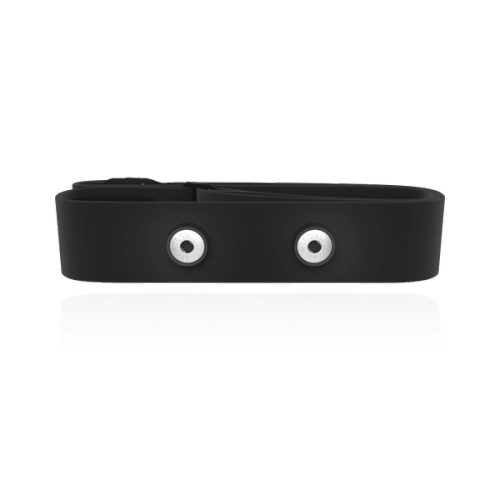
For zone-setting and threshold testing, data integrity is paramount. It’s where the Polar H10 chest strap becomes a necessary piece of equipment rather than a luxury. Instead of inferring heart rate from blood flow changes through the skin, it detects the heart’s electrical signals directly using chest electrodes—the same underlying principle as clinical ECG measurement, which serves as the reference standard for consumer-grade accuracy. Capturing clean, uncompromised data during your performance tests ensures that your newly calibrated zones reflect genuine metabolic strain rather than sensor artifacts.
undefined
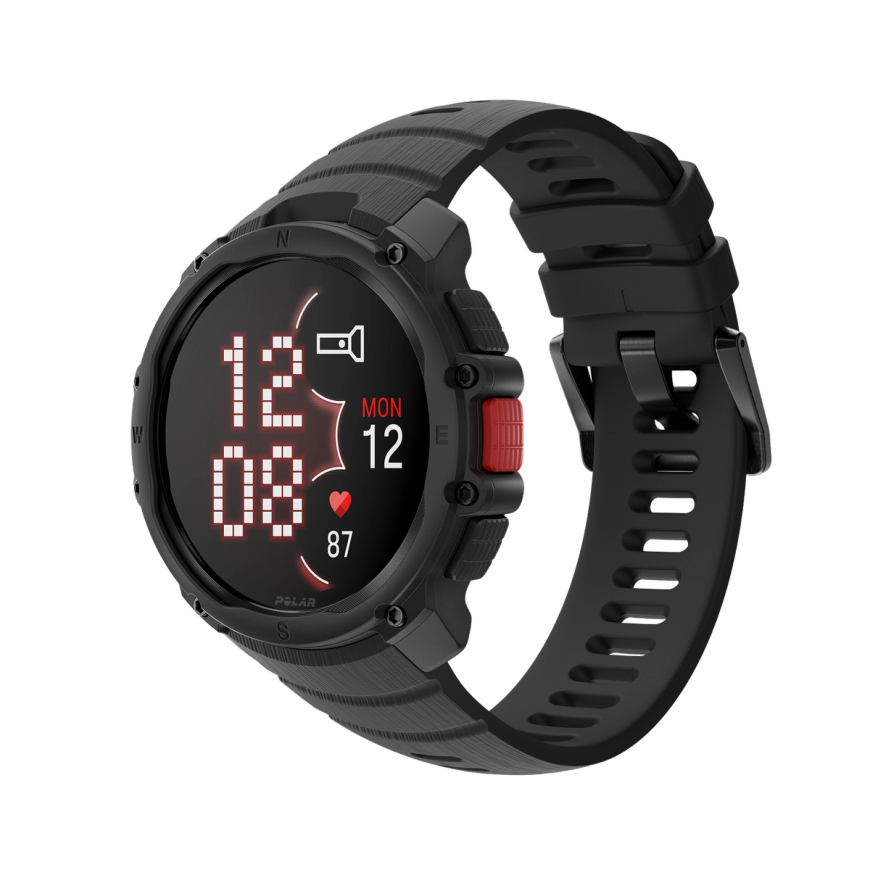
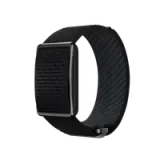
POLAR Street X
The Urban Sports Watch
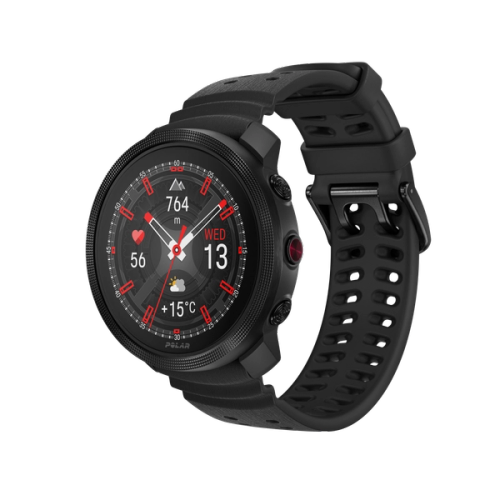
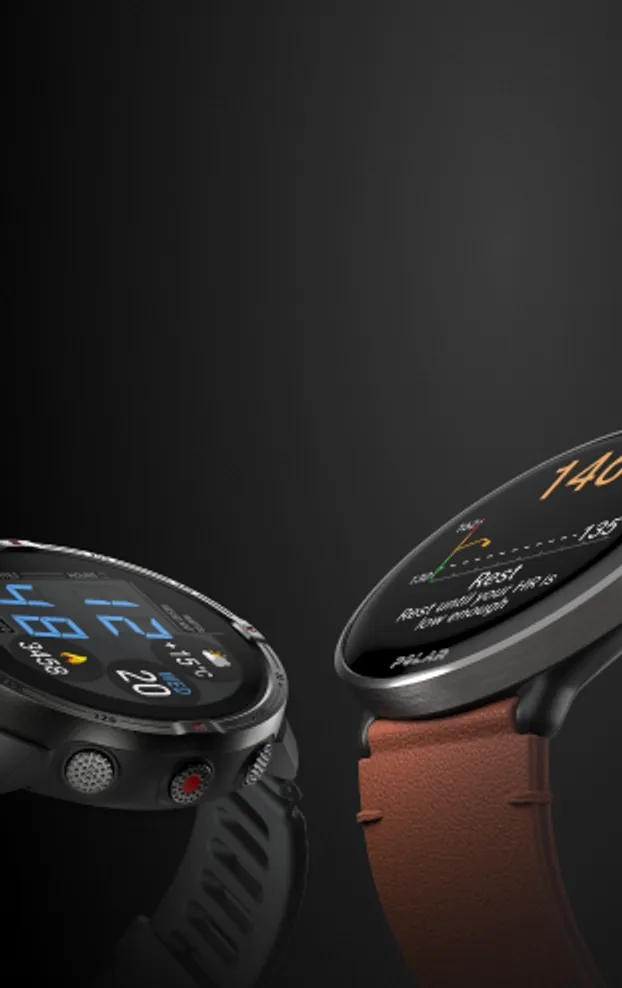
POLAR Street X is the urban sports watch for those who live, work, and train in the city. Tough, lightweight, and always ready, it delivers reliable GPS, a bright AMOLED display, precision heart-rate tracking, and 24/7 shock resistance for training, commuting, and everyday wear.
Step 2: How to Find Your Running Training Zones
When it comes to mapping your physiological boundaries, a professional laboratory lactate test remains the absolute gold standard. By stepping onto a treadmill and undergoing incremental workload increases while a technician takes serial blood draws, you get an unmistakable reading of exactly where your metabolic thresholds sit. It strips away all guesswork.
However, between the high cost and limited scheduling availability, regular lab access is impractical for most recreational athletes. Fortunately, you can achieve highly reliable, actionable data right on your local track through structured field testing.
How do I find my maximum heart rate?
You can find your personal heart rate training boundaries at home by executing a structured field test—such as the Polar Running Performance Test—which measures actual maximal and submaximal limits to override generic formula estimates. Transitioning to field tests allows you to anchor your daily pacing to real-world performance metrics rather than population averages.
The Polar Running Performance Test is a built-in, guided tool that removes the complexity of field testing. The protocol begins with a thorough, incremental warm-up. Once your body is ready, the watch introduces a ramp protocol, presenting a target speed wheel on your screen. Your job is simple but demanding: increase your pace gradually to keep your avatar locked into the shifting target zone as the speed requirements increase.
Depending on your current fitness level and training goals, you can execute this test using one of two protocols:
- The Maximal Test: This track requires you to follow the increasing pace until you reach absolute physical exhaustion. While highly demanding, it captures a verified, individual HR max.
- The Submaximal Test: If you aren’t prepared to push to your absolute limit, this variation only requires you to reach at least 85% of your estimated maximum intensity. The Polar algorithm then estimates your maximum heart rate from your submaximal effort data.
Calibrating your heart rate while running against a measured maximum—rather than an age-based guess—eliminates the primary source of zone miscalculation.
If a strenuous ramp effort isn’t appropriate given your current fitness, you can use gentler alternatives. The Polar Fitness Test uses RHR and heart rate variability (HRV), along with personal data inputs—age, height, weight and activity level—to produce an estimate in just 5 quiet minutes. For an active submaximal option, the Polar Walking Test offers a safe, accessible field metric: by walking at a brisk, steady pace for 15 minutes on flat terrain, the algorithm uses your speed and heart rate to calculate your aerobic capacity (VO2max). Alternatively, you can use the classic ‘Talk Test’ during an easy run to pinpoint your specific zone 2 ceiling. If you can still form full, coherent sentences but the conversation requires noticeable, clear effort, you have successfully located the upper boundary of your aerobic base. Using these native tools transforms lactate threshold training from an abstract scientific concept into a practical, daily asset.

Step 3: How to Find Your Cycling Training Zones
Shifting your focus from the track to the bike requires a fundamental shift in how you measure work. While running intensities are heavily driven by heart rate and pace, cycling performance is optimized through a completely different primary metric: power.
The distinction between tracking power output and relying solely on heart rate comes down to responsiveness and objectivity. Power output is instantaneous. The moment you press hard into the pedals to climb a steep hill, your power meter registers that immediate spike in wattage. Heart rate, by contrast, inherently suffers from a physiological lag, often taking 30 to 60 seconds to catch up to a sudden muscular effort.
Furthermore, your heart rate is highly volatile—it can be easily manipulated by environmental heat, underlying training fatigue, dehydration, or even a pre-workout espresso. A watt, however, remains objective regardless of external variables, making it the most reliable anchor for cycling intensity.
To pinpoint your precise cycling boundaries, your device utilizes the built-in Polar Cycling Performance Test. This test requires a connected, third-party power meter paired with your watch to execute a functional threshold power (FTP) protocol. Typically structured as a sustained, maximal effort—most commonly for 20 minutes—the test challenges you to maintain the absolute highest power output you can manage without burning out before the timer expires.
Once completed, Polar Flow uses your resulting FTP wattage to establish a highly customized map of your power-based training zones. This baseline ensures that when you hit the road or the trainer, you are targeting precise metabolic adaptations based on your current physical capabilities rather than generic calculations.
Why Your Zones Must Be Sport-Specific
Taking your running heart rate zones and applying them to your cycling or swimming profiles inside Polar Flow introduces a major systemic error. Your heart rate is a dynamic response to the unique mechanical and metabolic demands of the specific sport you are practicing.
The underlying physiology comes down to active muscle mass and gravity. Running is a weight-bearing activity that recruits massive amounts of muscle across your legs, core, and upper body for stabilization. This extensive muscular recruitment places a high demand on oxygen delivery, which in turn raises your heart rate.
Cycling, however, removes the impact of gravity and shifts the stabilizing workload to the bike frame, isolating the effort primarily to your lower body. Because less total muscle mass is actively demanding oxygen, a cyclist’s heart rate at their LT1 typically runs measurably lower than their running threshold—a well-documented effect of the reduced muscle mass recruitment and postural differences between the two sports. Swimming drops these boundaries even further; the horizontal body position reduces the work your heart must do to pump blood against gravity, while the water’s conductive cooling naturally suppresses your heart rate relative to your actual physical effort.
Should my running and cycling zones be different?
Yes, your running and cycling training zones must be configured independently because your body responds to the unique biomechanical demands of each sport with different heart rate profiles. Using a single set of zones means you will systematically under-train on your runs or over-train on your rides.
Real-world environmental variables, such as heat (which triggers cardiovascular drift by diverting blood to the skin for cooling) and altitude (which reduces oxygen and elevates your heart rate), will actively shift these metrics in real time. For multi-sport athletes, this is why utilizing Polar’s independent sport profiles is so critical. By using sport-specific tests and applying those unique boundaries to their respective profiles, you ensure that your watch screen always reflects the exact physiological reality of the workout you are currently crushing.
Step 4: Configuring Custom Profiles in Polar Flow
Once you have gathered your precise field data, the final step is to transition from physiology to application. Overriding the default, formula-based settings on your device happens entirely within the Polar ecosystem. By inputting your custom parameters, you ensure your watch guides your training sessions with absolute accuracy.
Here is the step-by-step technical checklist to update your device settings:
- Log into Polar Flow: Open the Polar Flow mobile app on your smartphone or access the web portal.
- Navigate to Sport Profiles: Open the main menu and select Sport Profiles to view your active disciplines.
- Select Your Sport: Choose the specific profile you wish to adjust first (for example, running).
- Edit Heart Rate Settings: Scroll down to locate the Heart Rate (or Power) settings dropdown menu.
- Switch to Custom Zones: Change the Zone Selection setting from Default to Free or Custom.
- Input Your Test Data: Manually enter your verified HRmax or specific threshold values achieved during your performance tests.
- Sync Your Device: Connect your watch via Bluetooth to the Flow app to push the updated boundaries directly to your watch screen.
Your cardiovascular fitness is dynamic, meaning these settings are not permanent. To determine when it’s time to recalibrate, track your progress using Polar’s Running Index feature after your aerobic sessions. A persistent upward trend in your score across several weeks indicates that your stroke volume has increased and your running efficiency has improved. When you notice this steady adaptation, it signals that your body is ready to re-test, allow your zones to elevate, and establish a new baseline.
The Common Pitfalls of Zone Personalization
Transitioning to personalized metrics is the most effective way to optimize your training, but the process is highly sensitive to input errors. The most frequent misstep athletes make is mixing real data with guesswork—specifically, pairing a verified training threshold with an estimated HRmax. Doing so completely compromises the math your device uses. In fact, research confirms that estimating your maximum values, rather than measuring them directly, meaningfully degrades zone calculation accuracy—with speed-derived estimates performing best only when maximum values are verified through testing (Nuuttila et al., 2025). If you’re going to personalize your tracking, you must commit to using fully tested data.
Another critical pitfall stems from relying on male-centric physiological models. Traditional fixed-intensity zone boundaries have historically been built around data derived primarily from male cohorts. However, recent sports science reveals a significant female athlete variance: female recreational runners consistently demonstrate higher fractional utilization and higher relative intensities at their LT1 than generic population anchors predict (Nuuttila et al., 2025).
If you’re a female athlete and your easy recovery runs consistently feel unusually taxing at your calculated zone 2 pace, your individual threshold is likely much higher than a generic default model assumes. This discrepancy underscores why you cannot rely on standardized templates. Trust your personalized test data over default software expectations every time.
Stop Guessing, Start Training
As we’ve seen, relying on standard, age-based formulas keeps your daily workouts misaligned with your actual metabolic thresholds. True precision requires matching your training boundaries to your unique physiology, ensuring every mile or mile repeat serves its exact purpose.
Your next step is simple: schedule a Polar Running Performance Test on your calendar for this week. Once you capture your numbers, calibrate your findings inside Polar Flow and head out for an easy session. When you lock into your personalized zone 2 boundary, you’ll instantly notice the difference in your pacing, performance, and ultimate workout recovery. It is time to let real data guide your wrist.
Enjoying this article? Subscribe to the Polar Newsletter and get notified when new articles are out.
Subscribe
References
Robergs, R. A., & Landwehr, R. (2002). The surprising history of the “HRmax=220-age” equation. Journal of Exercise Physiology Online, 5(2), 1–10.
Jamnick, N. A., Pettitt, R. W., Granata, C., Pyne, D. B., & Bishop, D. J. (2020). An examination and critique of current methods to determine exercise intensity. Sports Medicine, 50(10), 1729–1756. https://doi.org/10.1007/s40279-020-01322-8
Nuuttila, O-P., Kaikkonen, P., Sievänen, H., Vasankari, T., & Kyröläinen, H. (2025). The accuracy of fixed intensity anchors to estimate lactate thresholds in recreational runners. European Journal of Applied Physiology. https://doi.org/10.1007/s00421-025-05748-8



 POLAR Street X
New
POLAR Street X
New
 Polar Vantage M3
 Polar Grit X2 Pro Titan
 Polar Grit X2 Pro
 Polar Grit X2
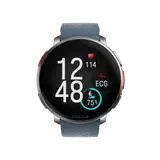 Polar Vantage V3
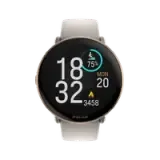 Polar Ignite 3
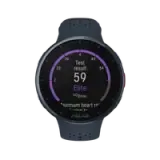 Polar Pacer Pro
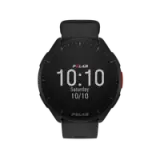 Polar Pacer
 Polar Unite
Grit X Series
Vantage Series
Pacer Series
Ignite Series
Polar Unite
Grit X Series
Vantage Series
Pacer Series
Ignite Series