 POLAR Street X
New
POLAR Street X
New
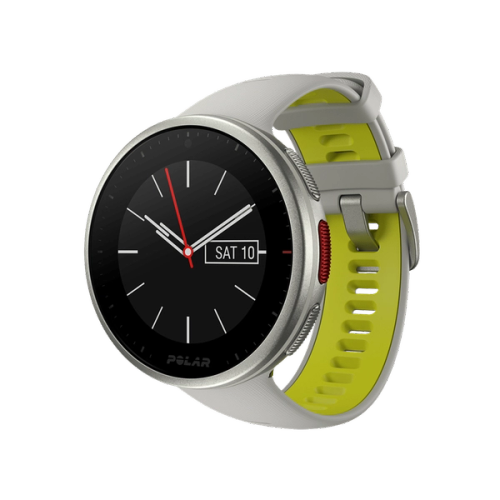
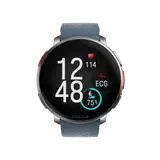
 Polar Vantage M3
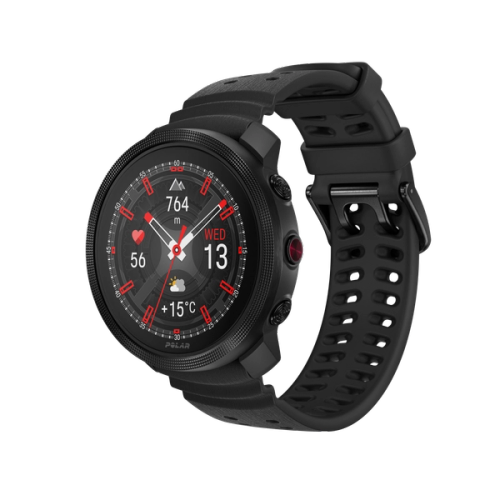
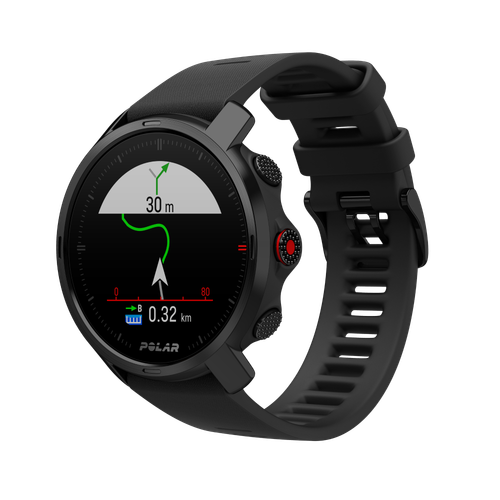
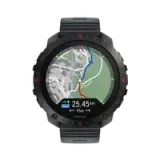
 Polar Grit X2 Pro Titan
 Polar Grit X2 Pro
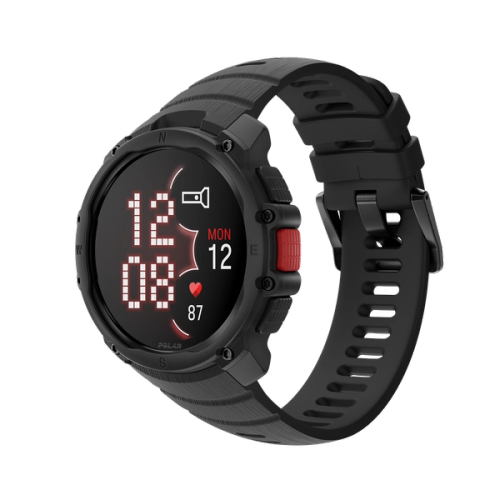
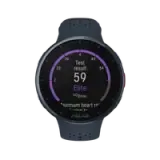
 Polar Grit X2
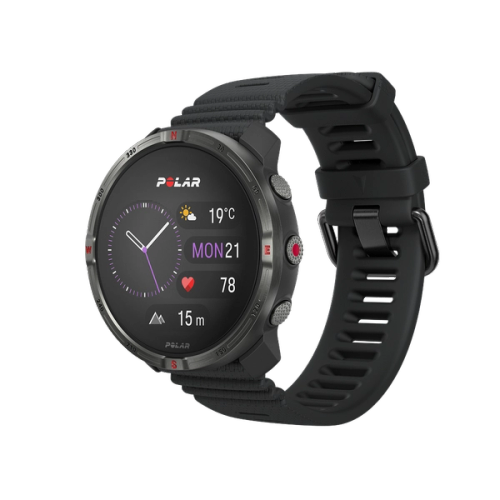
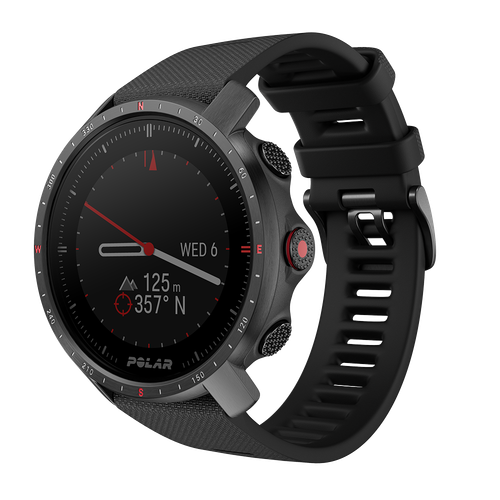
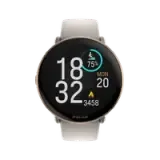
 Polar Vantage V3
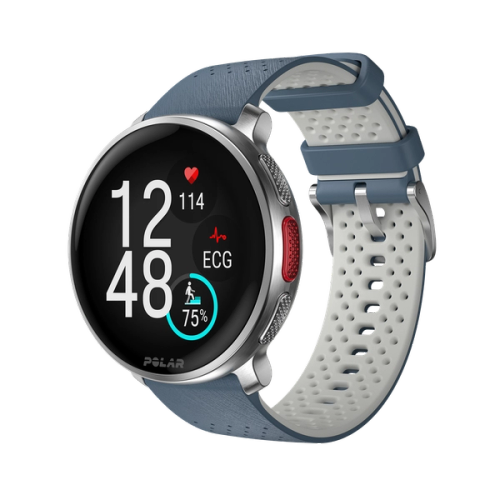
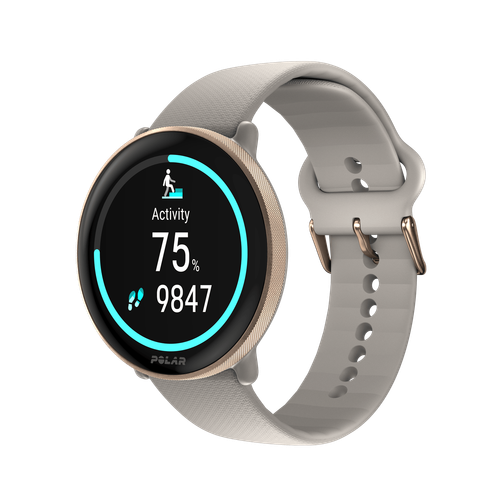
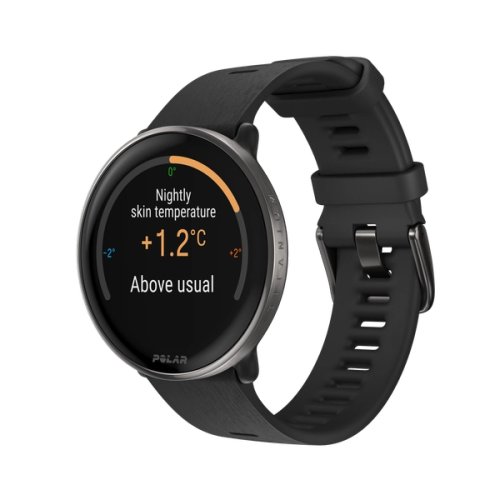
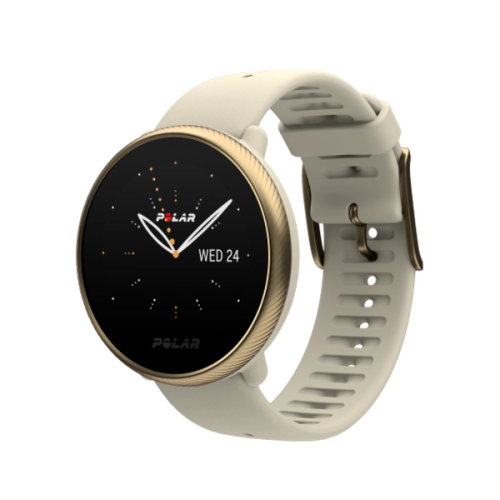
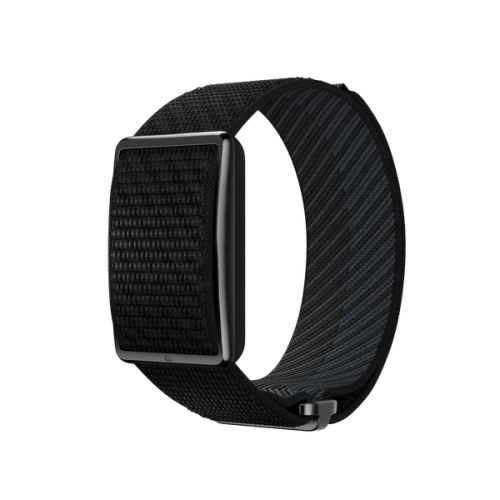
 Polar Ignite 3
 Braided Yarn
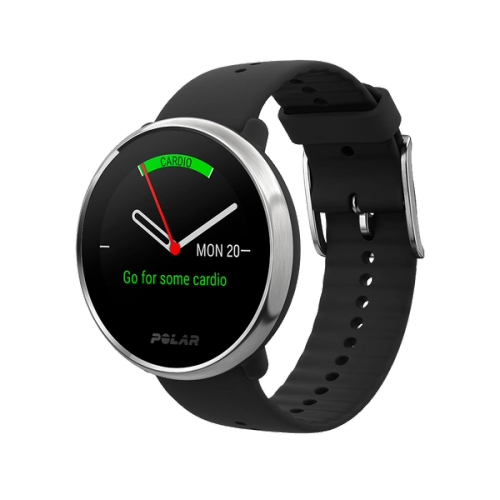
Polar Ignite 3
Polar Ignite 3 Braided Yarn
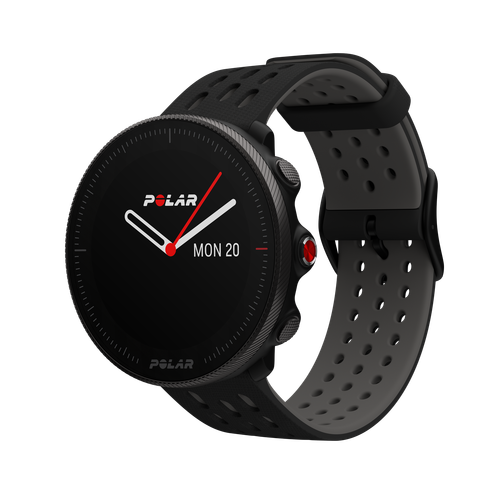
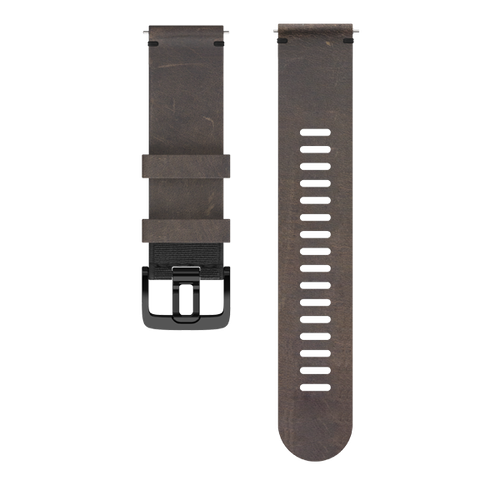
 Polar Pacer Pro
 Polar Pacer
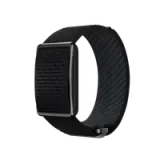
 Polar Unite
Grit X Series
Vantage Series
Pacer Series
Ignite Series
Polar Unite
Grit X Series
Vantage Series
Pacer Series
Ignite Series